
Common eCommerce analytics mistakes often begin before anyone builds a dashboard: teams track the wrong goals, use inconsistent data, miss key customer actions, or choose tools that do not work together. The result is a store report that looks precise but leads to poor decisions. Fix the measurement system first, and the insights become more useful.
It is easy to assume that more metrics or a more advanced platform will bring clarity. But when reporting priorities are unclear or tracking has gaps, adding tools can create more noise instead of better direction.
This article covers reporting, data, tracking, and tool-selection mistakes that can skew eCommerce insights. Learn how to set clearer measurement priorities, identify unreliable inputs, and choose analytics tools that connect customer behavior with marketing and sales performance. Use these steps to turn store data into decisions your team can act on.
Key Takeaways
- Set reporting goals around business priorities so dashboards highlight decisions that matter, not just data that’s easy to collect.
- Standardize data formats and staff procedures to reduce inconsistencies that can distort comparisons.
- Audit traffic and conversion tracking across the customer journey to uncover gaps that hide how shoppers behave.
- Choose analytics tools that bring marketing, customer, and sales insights together in a clear, usable view.
1. What Key Challenges Do E-commerce Businesses Face When Setting Up Reporting Systems?
Start with the decision a report needs to support, then choose metrics that answer it. If the goal is profitable growth, track revenue, average order value, and customer lifetime value. Page views and social likes can indicate audience attention, but they are vanity metrics unless linked to buying behavior. Ask what action the team would take if a metric changed.
Define each metric before teams build dashboards. Specify its formula, data source, reporting period, and owner. For example, decide whether revenue means gross sales or sales after discounts, cancellations, and returns. More than 70% of surveyed business leaders reported that inconsistent data hindered decisions and reduced confidence in analytics outputs. Clear definitions give teams a shared baseline and help expose errors.
Design visualizations around decisions, not decoration. Put the primary KPI first, label units and date ranges, and use a trend line when the direction matters. Keep comparisons consistent, such as this month against the same period last year. Poor dashboards can cost enterprises 10–15% of productivity, so remove charts that don’t help stakeholders act. Simple displays make exceptions and shifts easier to spot.
Returns and cancellations reduce completed sales, while discounts reduce the amount collected against list prices. Shipping charges and costs can also affect reported revenue or margin, depending on how the business defines each measure. Report these components separately and document how they are treated so comparisons follow consistent rules.
Staff training helps keep reporting reliable after launch. Give employees a concise data-entry guide with examples for product names, campaign tags, dates, and currency formats. When a format changes, update the guide and retrain affected teams before comparing new data with older reports. Review dashboard definitions with stakeholders regularly, and assign someone to resolve errors. These practices reduce the chance that common eCommerce analytics mistakes will distort decisions.
2. Inconsistent data formats and measurement standards
A product feed may label a size as “10,” while another platform stores “10 inches.” Dates, currencies, product IDs, and campaign tags can also vary between systems. Set one format for each field, then document it in a shared data dictionary. The Mars Climate Orbiter burned up in Mars’s atmosphere in 1998 after units were improperly converted to metric. For ecommerce, mismatched units can produce less dramatic but still costly reporting errors.
Build quality controls into the workflow. Use required fields and automated validation to flag blank SKUs, invalid dates, duplicate orders, and unexpected currency codes before they enter reports. A product attribute accuracy threshold of 98% offers one example of a quality target. Schedule quarterly spot-checks of 5–10% of SKUs, then correct the source record and document the change. Automation catches repeat errors; human review handles unusual cases.
Data security needs its own operating plan. Limit access by role, protect exported customer files, and specify who can restore records after accidental deletion. Keep backups separate from everyday working data, and test recovery steps with a sample dataset. A backup that has not been restored successfully is an untested assumption, not a recovery plan.
For U.S. stores, privacy and consent obligations depend on the states served and how analytics data is collected. California’s CCPA penalties can reach $7,500 per intentional violation, so document data use, consent choices, and access controls.
Attribution can mislead when a model gives too much credit to one touchpoint. Compare multi-touch or data-driven attribution with the customer journey instead of treating one channel’s reported conversions as the whole story.
Connect the ecommerce platform, analytics, advertising, and CRM systems using consistent IDs and synchronized event definitions. Review performance data weekly or monthly to spot trends, then trace unexpected changes back to their source before optimizing campaigns. Strong data integration can help organizations outperform peers in revenue growth and operational efficiency by up to 30%. If system handoffs are obscuring the picture, map your analytics workflow as the next step.
3. Tracking traffic, conversion rates, and user behaviour
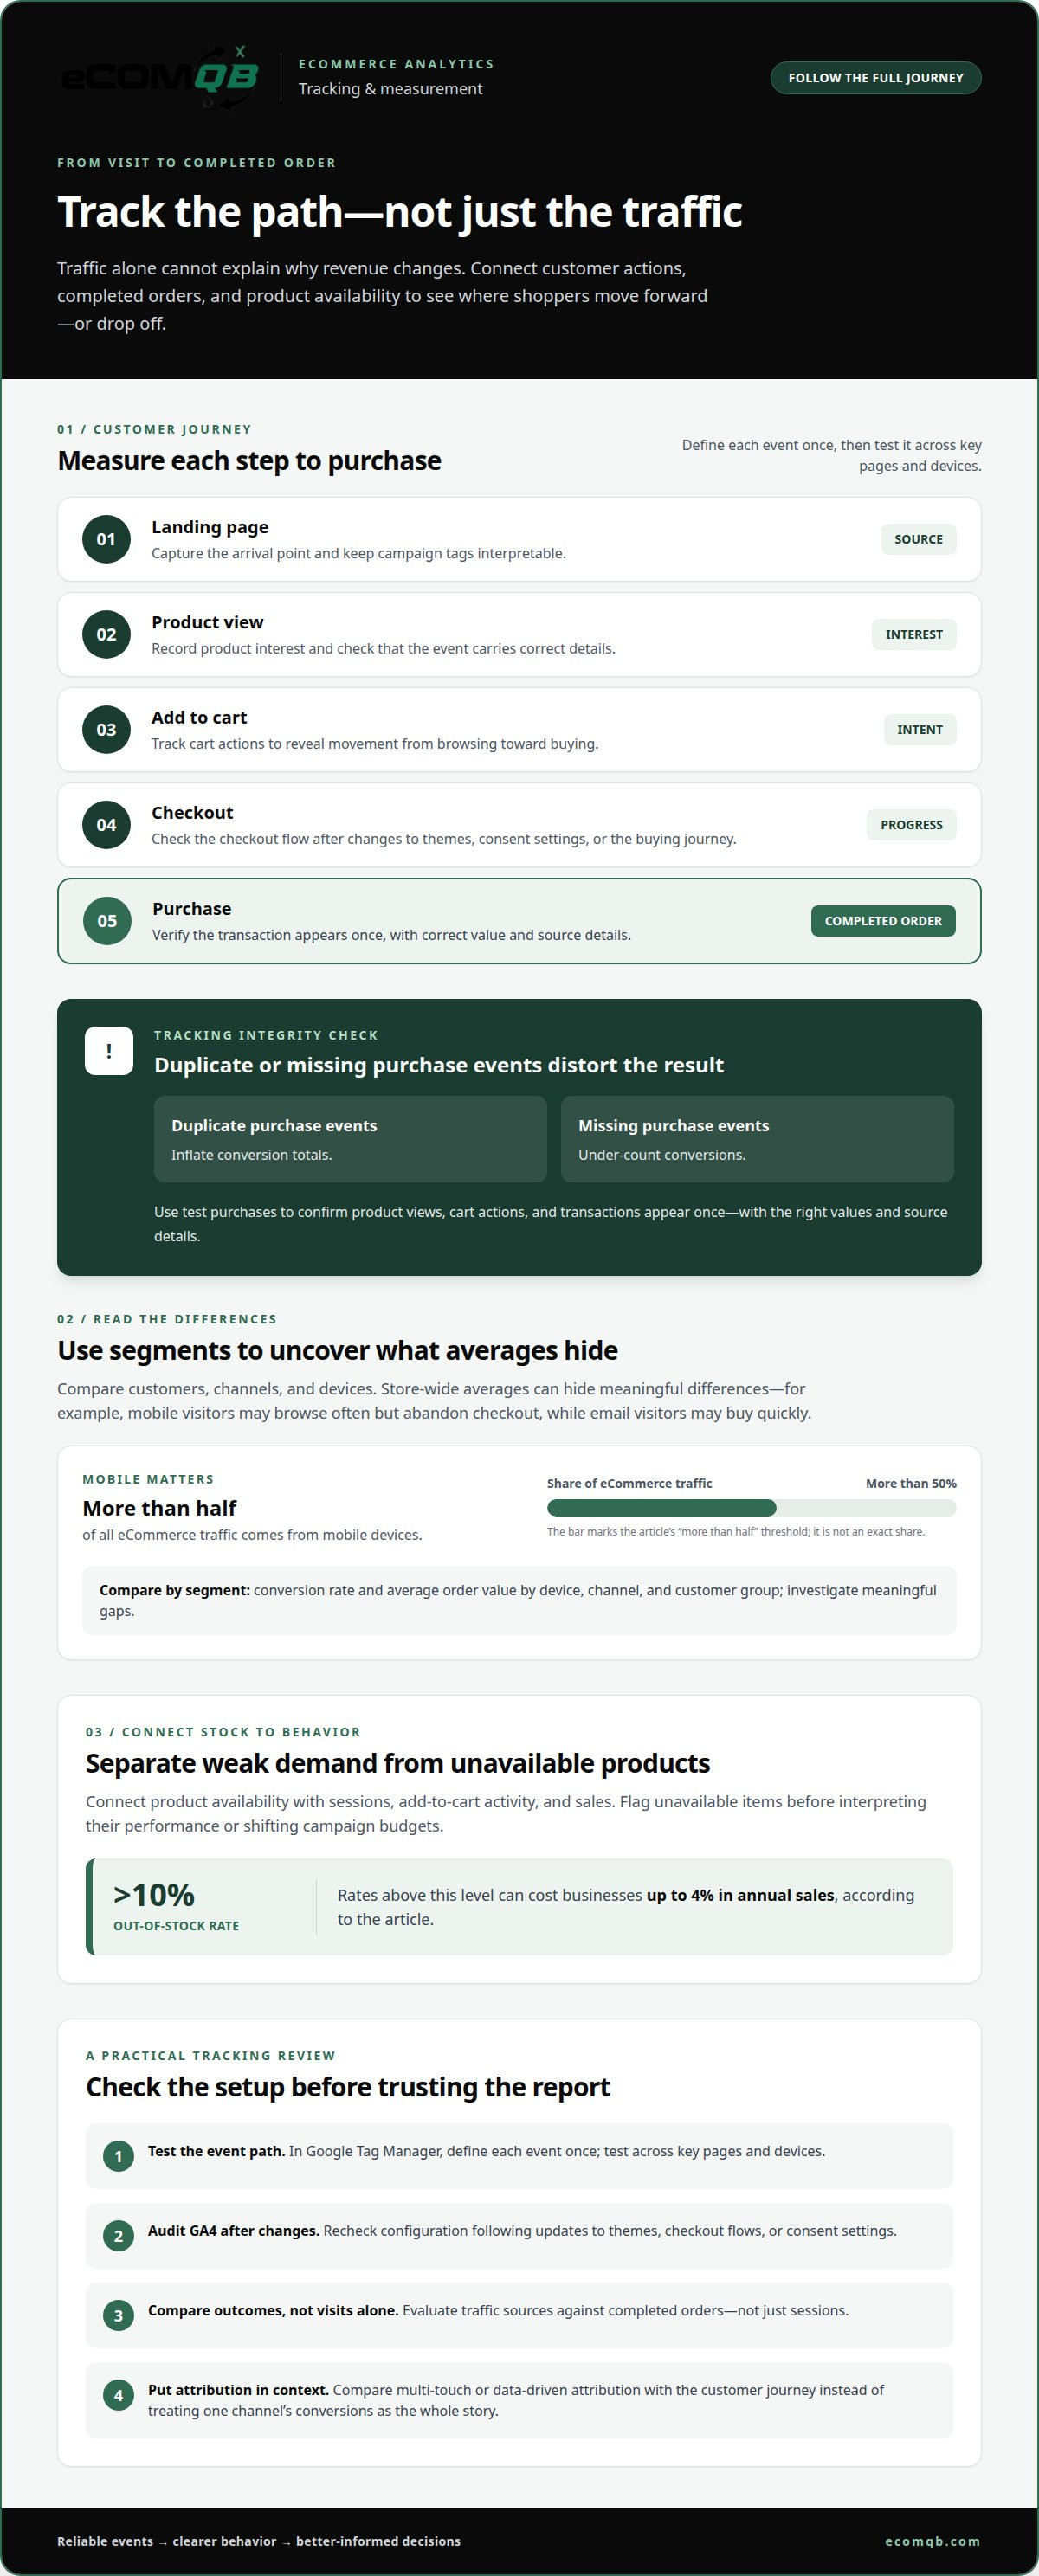
Traffic alone cannot explain why revenue rises or falls. Track the path from landing page to product view, add to cart, checkout, and purchase. In Google Tag Manager, define each event once, then test it across key pages and devices. Compare traffic sources with completed orders, not just sessions. This shows whether a channel attracts shoppers who convert or visitors who leave.
Segment customers, channels, and devices to reveal differences hidden by store-wide averages. Mobile shoppers may browse often but abandon checkout, while email visitors may buy quickly. More than half of all eCommerce traffic comes from mobile devices, so device-level analysis is especially relevant. Compare conversion rate and average order value by segment, then investigate meaningful gaps.
Audit GA4 configuration after changes to themes, checkout flows, or consent settings. Use test purchases to confirm that product views, cart actions, and transactions appear once, with correct values and source details. Duplicate purchase events inflate conversion totals; missing events undercount them. Check landing pages, referral exclusions, and campaign tags so acquisition sources remain interpretable.
Inventory tracking belongs beside marketing analytics. Connect product availability with sessions, add-to-cart activity, and sales so teams can distinguish weak demand from unavailable stock. Out-of-stock rates above 10% can cost businesses up to 4% in annual sales. Flag unavailable products in reports, then compare their traffic and conversion patterns with in-stock items before shifting campaign budgets.
Set a focused KPI set for each funnel stage: qualified traffic, product-page engagement, checkout completion, and purchase conversion. Review the measures weekly or monthly, and annotate launches or promotions that may explain shifts. The average cart abandonment rate is almost 70%, so track checkout steps to locate drop-offs rather than treating every abandoned cart alike. In GA4, compare device, source, and landing-page reports to identify where the journey breaks. A clean event map turns raw analytics into practical next moves.
4. Selecting analytics tools
The right analytics stack connects evidence, not just dashboards. Start with the decisions your team needs to make, then map each one to the data required. Diagnosing campaign performance, for example, requires ad spend, traffic source, product activity, and completed sales. A tool that collects only sessions cannot explain which campaigns support revenue. Define the questions first, then compare platforms.
Assess each platform’s ability to connect with your store, advertising channels, and CRM. Unified dashboards can bring GA4, marketing-platform, and CRM insights together, linking customer behavior with spend and sales. Check whether key fields retain consistent names and values across integrations. If a campaign source disappears between systems, channel comparisons become unreliable, even when each individual report looks polished.
Test the reporting experience with a real task. Ask a team member to find a landing page’s traffic, conversion activity, and sales contribution without help. Visualization tools should offer useful formats, such as graphs, charts, and maps. Choose the simplest display that answers the question. A clear trend chart can reveal a shift faster than a crowded dashboard full of automated widgets.
Distinguish descriptive analytics from predictive features. Descriptive reports show what happened; predictive tools can visualize complex patterns and forecast the success rate of business decisions. Treat forecasts as planning inputs, then compare them with actual outcomes. Before adopting a tool, test a representative scenario, such as estimating demand after a campaign change, and identify the data behind its output.
Finally, score candidate tools against integration fit, data clarity, team usability, and maintenance effort. Run the same reporting task in each shortlisted platform, then record missing fields, manual steps, and conflicting totals. Reject features that add complexity without supporting a defined decision. If you’re ready to align your analytics stack with growth priorities, book a strategy call.
EComQB: Revenue Generating AI Tools
eComQB can help when reliable reporting needs to inform better growth decisions. Its Revenue Generating AI Tools and AI transformation for eCommerce Brands bring AI into growth strategies built on proven systems. When campaign performance is the priority, Agentic Media Buying and Meta Advertising Execution connect marketing activity with the insights teams use to guide investment. Start by defining the decision your data should support, such as where to refine media buying or how to apply AI across the business. Then choose a next step that serves that priority instead of adding technology without a clear role.
Contact eComQB to discuss how its services can support your eCommerce growth priorities.
Turn better data into your next growth move
Reliable analytics are not a reporting finish line. They are an operating discipline: connect each insight to a decision, assign ownership, and learn from the results. This approach helps your team move beyond common eCommerce analytics mistakes and use measurement to guide its next growth priorities.
Identify the decision your current setup makes hardest. Is it understanding which channels bring valuable customers, finding friction in the shopping journey, or turning performance data into a clearer strategy? A focused conversation with eComQB can help translate that priority into a practical plan using AI and proven growth systems for eCommerce.
Contact eComQB to discuss your analytics and the decisions you want your data to support. Build from a clear priority, make your next move with confidence, and keep momentum on your side.
Frequently Asked Questions
What Are the Best Practices for Measuring the Effectiveness of Marketing Campaigns Across Channels?
Use consistent campaign names and compare channels against the same business outcome. For a product launch, track whether each channel brings in first-time buyers, repeat customers, or both. Separate branded searches from campaign-driven demand, and compare equivalent time periods. This helps distinguish channels that capture existing interest from those that introduce your store to new audiences.
What Key Challenges Do E-commerce Businesses Face When Setting Up Reporting Systems?
A common challenge is assigning clear ownership to each decision and report. Marketing, for example, may define campaign success by customer acquisition, while finance prioritizes contribution to profit. If both teams use the same dashboard without agreeing on the decision it supports, they may reach different conclusions from identical results. Define the audience, owner, and intended action for every recurring report.
What are the most common eCommerce analytics mistakes?
Several common eCommerce analytics mistakes arise from treating correlation in reports as proof of cause. A sales lift during a promotion may also reflect seasonality, a product launch, or demand that was already building. Record major business changes alongside performance results, then compare similar periods and customer groups. This context helps teams avoid crediting a single marketing activity for every change.
Why is inaccurate or inconsistent eCommerce data a common problem?
Store data often passes through different workflows before reaching a report. A staff member may adjust an order manually while a payment platform records a separate transaction status. These records may describe different stages of the same purchase. Trace a sample order from storefront to payment to reporting, then identify where definitions or timing diverge. This helps pinpoint the source of discrepancies.
What eCommerce metrics are often misinterpreted or overemphasized?
Return on ad spend can look strong even when a campaign attracts low-value customers or depends on heavy discounts. Average order value can also rise because a small group places unusually large orders. Pair each headline metric with a quality check, such as repeat purchasing or margin contribution. This reveals whether a positive-looking result supports durable business performance.
How can duplicate transactions and missing events distort eCommerce reports?
A duplicate purchase event can make one order appear as two conversions, overstating campaign results. Missing events create the opposite problem: a completed checkout may appear to have stopped at the payment step. Test different purchase paths, including refreshing the confirmation page and using payment redirects. Compare analytics events with actual order records to find repeated or missing transactions before interpreting conversion trends.