Cost of Customer Acquisition by Industry: 2026 Benchmarks and How to Use Them

An industry average can make a healthy acquisition strategy look broken, or hide one that’s quietly draining profit. The cost of customer acquisition by industry is a useful starting point, but a benchmark alone can’t tell you whether your CAC is sustainable. Sales model, customer value, conversion rates, and retention all change the equation.
If you’re asking what customer acquisition costs in your industry and whether your current number is healthy, the answer depends on more than your sector. Published benchmarks may use different definitions, reporting periods, and cost inputs. A paid-media-only figure isn’t comparable to a fully loaded CAC that includes sales and marketing salaries, tools, and overhead.
This guide explains how to compare benchmarks responsibly, calculate CAC consistently across channels and blended spend, and assess it against customer lifetime value and payback period. You’ll also learn how channel performance, storefront conversion, and retention affect the number, so you can set an acquisition target grounded in your unit economics rather than a broad average.
Key Takeaways
- Use cost of customer acquisition by industry benchmarks to find relevant comparisons, not to set a universal spending limit.
- Separate paid-media CAC from blended CAC so you know what each number includes.
- Assess acquisition costs against customer value, retention, and contribution margin before deciding whether they’re sustainable.
- Compare like with like by aligning customer definitions, attribution rules, reporting periods, and included costs.
- Connect channel performance with storefront conversion, personalization, and retention to identify potential CAC improvements.
What Does Cost of Customer Acquisition by Industry Actually Measure?
The cost of customer acquisition by industry compares how much businesses spend to gain customers. At its core, customer acquisition cost (CAC) is acquisition expense divided by the number of new customers acquired during a defined period. But the formula can produce very different results depending on which expenses count, how a new customer is identified, and the period covered. Customer acquisition cost offers a foundational overview of common calculation approaches.
How is customer acquisition cost calculated?
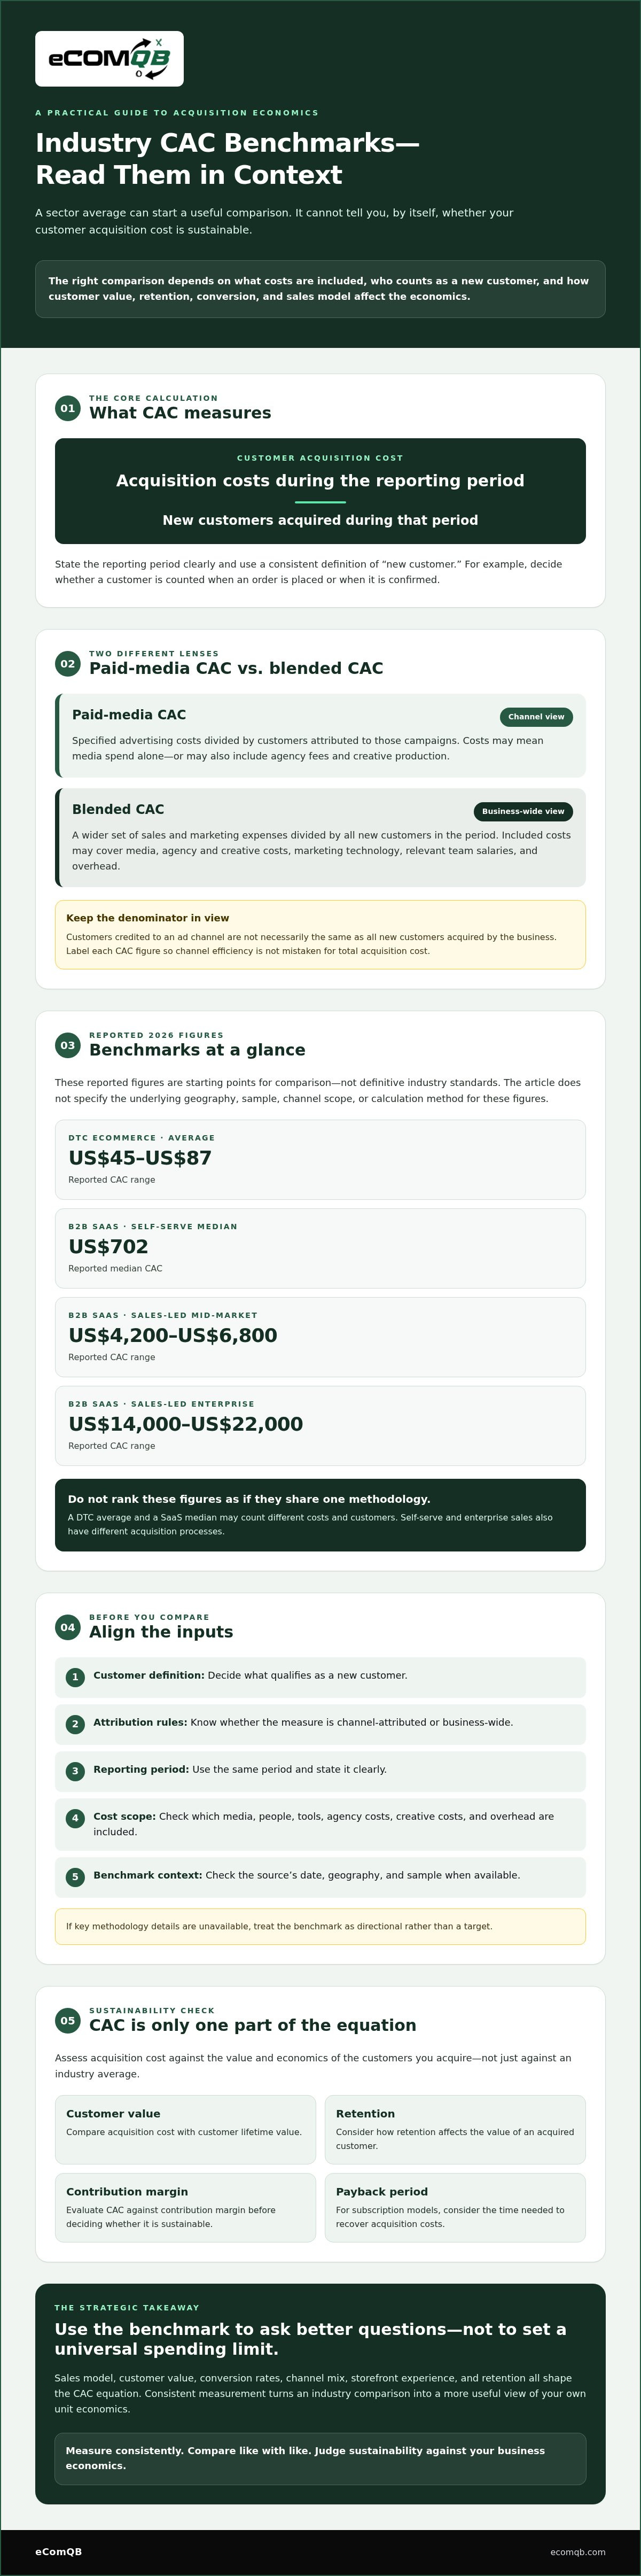
CAC = acquisition costs during the reporting period ÷ new customers acquired during that period. State the period clearly, such as a month, quarter, or year, and apply a consistent definition of “new customer.” For example, decide whether someone counts as a new customer when they place an order or when that order is confirmed.
Paid-media CAC divides specified advertising costs by the customers attributed to those campaigns. The cost may include media spend alone, or also campaign agency fees and creative production. Blended CAC generally includes a wider set of sales and marketing expenses, such as media, agency and creative costs, marketing technology, and relevant team salaries or overhead, divided by all new customers in the period. There’s no universal scope, so document what you include before comparing results.
The denominator matters just as much. Customers attributed to a channel aren’t necessarily the same as all new customers acquired by the business. An ad platform may credit a purchase to a campaign, while a blended calculation counts every new customer, regardless of source. Label each figure clearly so you don’t mistake channel efficiency for total acquisition cost.
Why do industry averages vary so widely?
Acquisition complexity differs by sector and business model. A frequent, lower-consideration purchase may require less marketing and sales effort than a high-value purchase involving research, multiple decision-makers, or a long sales cycle. Geography, audience, channel mix, and conversion experience can also shift results.
Business models change the equation. A company selling one-time purchases measures acquisition against those transactions. A subscription business may assess CAC alongside recurring revenue, retention, and the time needed to recover acquisition costs. Even within one industry, self-serve sales and sales-led enterprise deals can have very different cost structures and customer values.
A benchmark is meaningful only when its calculation matches yours. Before relying on a published figure, check its publication date, geography, sample, customer definition, reporting period, channel scope, and included costs. If those details aren’t available, treat the number as directional rather than a target. Use the comparison to sharpen your strategy, not replace your own measurement.
Cost of Customer Acquisition by Industry: How to Read 2026 Benchmarks
Use benchmarks to frame a question, not dictate a budget. The figures below report publication months, but don’t consistently identify publishers, geographies, sample sizes, channel scopes, or calculation methods. Treat them as starting points for comparison, not definitive industry standards. Check the methodology behind each figure before using it to set a target or make an investment decision.
| Sector and model | Reported 2026 CAC | Publication timing | Geography, sample, scope, and definition |
|---|---|---|---|
| DTC eCommerce, average | US$45-US$87 | April, July, and September | Not specified in the reported figures; verify before comparing. |
| B2B SaaS, self-serve median | US$702 | April and July | Not specified in the reported figures; verify before comparing. |
| B2B SaaS, sales-led mid-market | US$4,200-US$6,800 | July | Not specified in the reported figures; verify before comparing. |
| B2B SaaS, sales-led enterprise | US$14,000-US$22,000 | July | Not specified in the reported figures; verify before comparing. |
Don’t rank these figures as if they share one methodology. A DTC average and a SaaS median may count different costs and customers. Self-serve and enterprise sales also involve different acquisition processes. Even figures in the same sector may not be comparable until their definitions and reporting periods align.
Which industries should the benchmark table compare?
Prioritize categories that match your customer and sales model. Keep DTC separate from B2B, and split SaaS by go-to-market motion when the comparison allows it. Figures are also reported for financial services and education, but the details needed to assess their samples, geography, and CAC definitions aren’t available here. Healthcare comparisons aren’t included, so avoid filling that gap with an unsupported estimate.
What makes an industry CAC source credible?
Check the publisher, publication date, underlying data period, sample composition, geography, and whether the result is a mean, median, range, or modeled estimate. Confirm which channels and costs are included. A marketing-budget guideline is not a CAC benchmark. For example, the Small Business Administration recommendation cited by Recharge concerns marketing spend as a share of revenue, not cost per new customer.
Keep the methodology alongside every benchmark you use. If you’re aligning acquisition measurement with channel execution and storefront performance, discuss your eCommerce growth strategy with eComQB.
Is Your CAC High or Healthy? Compare Benchmarks With Unit Economics
A benchmark can show where your reported CAC sits relative to a comparison group. It can’t tell you whether your business can afford that cost. To judge whether an industry comparison applies to your situation, connect acquisition spend to customer value, the margin you keep, and the time it takes to recover your investment.
How should CAC relate to LTV and gross margin?
Start by defining customer lifetime value (LTV) consistently. Revenue-based LTV estimates sales from a customer over a defined relationship. Gross-profit LTV accounts for the cost of delivering those sales. The second view is more useful for acquisition decisions because revenue isn’t the same as money available to cover CAC and other operating expenses.
For eCommerce, account for discounts, refunds, fulfillment, and repeat-purchase behavior when estimating customer value. Then consider contribution margin, or what remains after variable costs tied to the sale. A customer can generate substantial revenue and still be unprofitable to acquire if margins are thin or repeat purchases don’t materialize.
There’s no universal LTV-to-CAC ratio that settles the question for every business. Your target depends on margins, retention, growth priorities, and operating costs. Test your assumptions against actual customer cohorts rather than relying on an attractive forecast.
When does payback period matter more than the average?
Payback period measures how long it takes to recover acquisition costs from a customer’s contribution. A business with limited working capital may need faster payback to fund inventory, payroll, or continued growth. A company with more room to invest may accept a longer recovery period if retention and future contribution support the decision.
Compare payback across cohorts, channels, and customer segments where the data allows. A channel with higher initial CAC may bring customers who stay longer or make repeat purchases. A channel with lower reported CAC may look less attractive after refunds, discounts, or weak retention are included. Longer-term value is only as reliable as the retention assumptions behind it, so compare projections with observed behavior.
Keep channel-level CAC and blended CAC separate. Channel-level results help diagnose campaign performance; blended CAC shows the cost of acquiring all new customers across the business. Confusing the two can lead to the wrong budget decision. Assess both alongside margin and payback, then adjust your acquisition target to your cash-flow needs. For a focused review, review your acquisition economics with eComQB.
How to Compare Your CAC With Industry Benchmarks Step by Step
A useful comparison starts with clean inputs, not a quick glance at an industry average. Use this workflow to make the cost of customer acquisition by industry relevant to your business, then trace any gap to a lever your team can test.
- Choose your CAC view. Decide whether you’re measuring paid-media CAC for a specific channel or blended CAC across acquisition activity. List the included costs, such as media, creative, agency, sales, and marketing technology.
- Set one reporting period. Match the period used for spend and new-customer counts. Align campaign dates with the conversion window, and account for delays between a first interaction and a purchase where relevant.
- Define a new customer. Apply the same rule across your reporting and the benchmark. Separate first-time customers from repeat buyers, and distinguish all new customers from those attributed to a campaign or channel.
- Align attribution and cost categories. Record the attribution model and compare like-for-like expenses. A platform-reported CAC based on attributed conversions won’t match a blended figure based on every new customer unless you reconcile their scope.
- Segment the results. Break CAC out by channel, cohort, campaign, geography, and customer type when the data supports a useful comparison. Avoid drawing conclusions from small or incomplete segments.
- Select the closest benchmark. Match industry, business model, sales motion, period, and CAC definition. If key details differ or aren’t disclosed, treat the figure as directional rather than a target.
What data should a business prepare before comparing CAC?
Gather spend, first-time customer counts, campaign dates, and attribution settings. Include the costs required for your chosen CAC view, not just ad spend. Then reconcile Shopify orders with Meta Ads, Google Ads, and analytics reporting. Check that dates, conversion events, customer status, and channel credit follow consistent rules. A tracking mismatch can look like a performance problem.
How can teams turn benchmark gaps into tests?
Diagnose the gap before changing budgets. Higher media costs point to a different problem than weak landing-page conversion, lower average order value, or poor repeat purchasing. Follow the funnel from impression to click to purchase, then examine customer value and retention. This helps isolate whether the issue is the channel, audience, offer, creative, or storefront.
Prioritize controlled tests that change one key variable at a time. For example, test a new audience or creative while keeping the offer and landing page stable. Use the same measurement window and CAC definition to judge the result. For a structured approach to channel execution, explore the agentic media buying playbook and the eCommerce AI growth system.
Ready to turn your CAC data into a focused growth plan? Review your acquisition measurement with eComQB.
Build a More Profitable Acquisition Strategy With eComQB
Benchmarks show where your numbers sit. The next step is to improve the levers behind them. Rather than chasing the lowest cost of customer acquisition by industry, build a measurement plan that connects paid acquisition, storefront conversion, customer value, and retention. That gives your team a clearer view of what’s working and where to focus.
What should an eCommerce CAC review include?
Start with the measurement foundation. Confirm how CAC is defined, which costs are included, how conversions are attributed, and whether new customers are counted consistently. Then review performance by channel and customer cohort alongside payback assumptions. The goal is to find where the numbers diverge, not to make every channel look the same.
Next, examine the customer journey. Check whether landing pages match the promise in the ad, whether checkout creates unnecessary friction, and whether personalization helps shoppers find relevant products. Review repeat purchases and lifecycle activity too. A conversion issue, weak retention, or tracking gap can each affect how acquisition performance appears.
Separate findings into two groups: measurement fixes, such as inconsistent customer definitions or attribution settings, and strategic opportunities, such as changes to campaign execution, storefront experience, or customer communications. Fixing measurement first gives the team a more dependable basis for deciding what to test.
When can managed growth support make sense?
When advertising, storefront development, and retention efforts operate separately, it can be difficult to connect a campaign with what happens after the click. eComQB supports eCommerce brands with Meta and Google advertising execution, Shopify development, AI personalization, and email and SMS strategies. Coordinating these capabilities around shared business goals can help teams assess acquisition as part of a wider revenue and profitability system, rather than treating any one channel as the whole story.
For a broader view of how AI transformation can support eCommerce operations, explore the AI transformation playbook for eCommerce brands.
Bring your CAC definitions, channel results, customer cohorts, and growth priorities into one review. Book a call with eComQB to discuss your measurement approach and which levers your team may want to address next.
Turn CAC Benchmarks Into Your Next Growth Move
The cost of customer acquisition by industry can provide a useful point of comparison, but it can’t set your target. Strong decisions come from comparing like with like, then testing CAC against gross-profit contribution, retention, and payback. Keep channel-level results distinct from blended CAC, and use the data to identify the relevant lever, whether that’s media efficiency, storefront conversion, or customer value.
That takes coordinated measurement. eComQB’s managed eCommerce growth systems combine strategy with technology implementation, alongside Meta and Google advertising execution. The goal is to connect acquisition activity with the customer experience and business outcomes you’re tracking, not to promise a predetermined CAC result.
Bring your current CAC definitions, channel data, and growth priorities into a focused strategy discussion. Book a call with eComQB to assess your acquisition strategy and identify the next move your numbers can support. With a clear measurement plan and disciplined tests, you can build a growth strategy grounded in your business, not a benchmark alone.
Frequently Asked Questions
What is the average cost of customer acquisition by industry?
There’s no single average that applies across industries or business models. The 2026 figures discussed here include DTC eCommerce averages and separate SaaS benchmarks for self-serve and sales-led companies. Treat them as reference points, not targets: the available summaries don’t consistently disclose methodology, sample, geography, or included costs. Compare a figure only after checking how it was calculated and whether it matches your CAC definition.
How do you calculate customer acquisition cost?
Calculate CAC by dividing acquisition expenses during a defined period by the number of new customers acquired in that same period. First set the customer rule and reporting dates. Then decide which expenses to include, such as advertising, creative, agency, marketing technology, and relevant sales or marketing costs. Paid-media CAC uses a narrower cost and customer scope than blended CAC, so label each calculation clearly before comparing results.
Why does customer acquisition cost vary by industry?
CAC varies because the effort required to win a customer differs. Purchase frequency, product consideration, sales-cycle length, and the number of decision-makers all affect the investment needed to convert someone. Business model matters too: a one-time purchase has a different revenue pattern from a recurring subscription. Channel mix, audience, conversion rates, and customer value can also create large differences between businesses in the same sector.
What is a good CAC for an eCommerce business?
A good CAC is one your business can recover while preserving enough margin to cover operating costs and profit goals. The 2026 DTC eCommerce range in this article is a comparison point, not a spending rule. Assess your own CAC against contribution margin, refunds, repeat purchases, retention, and payback time. A broad industry average can’t account for your specific economics.
How do you compare CAC across marketing channels?
Use the same reporting period, new-customer definition, attribution window, and cost categories for every channel. Keep platform-attributed CAC separate from blended CAC, which divides broader acquisition spending by all new customers. Compare channels by cohort or customer type when the data supports it, and consider downstream value as well as initial conversion. Otherwise, attribution differences or inconsistent tracking can make one channel appear more efficient than it is.
Should CAC include agency fees and creative costs?
Include them in a fully loaded or blended CAC when they’re part of acquiring customers, and state that scope in your reporting. For a paid-media-only view, you may track media spend separately, but don’t compare it directly with a benchmark that includes agency, creative, technology, or team costs. Keeping both views can help distinguish campaign performance from the broader investment required to bring new customers into the business.
How does customer lifetime value affect an acceptable CAC?
Customer lifetime value helps show what acquisition spending may be sustainable, but use gross-profit contribution rather than revenue alone to account for the cost of serving customers. Factor in retention, repeat purchases, refunds, discounts, and other relevant variable costs. Then compare expected contribution with CAC and the time needed to recover it. Test longer-term value assumptions against actual customer behavior, since weak retention can undermine an otherwise appealing projection.