ECommerce Cart Abandonment Analysis: 2026 Practical Guide

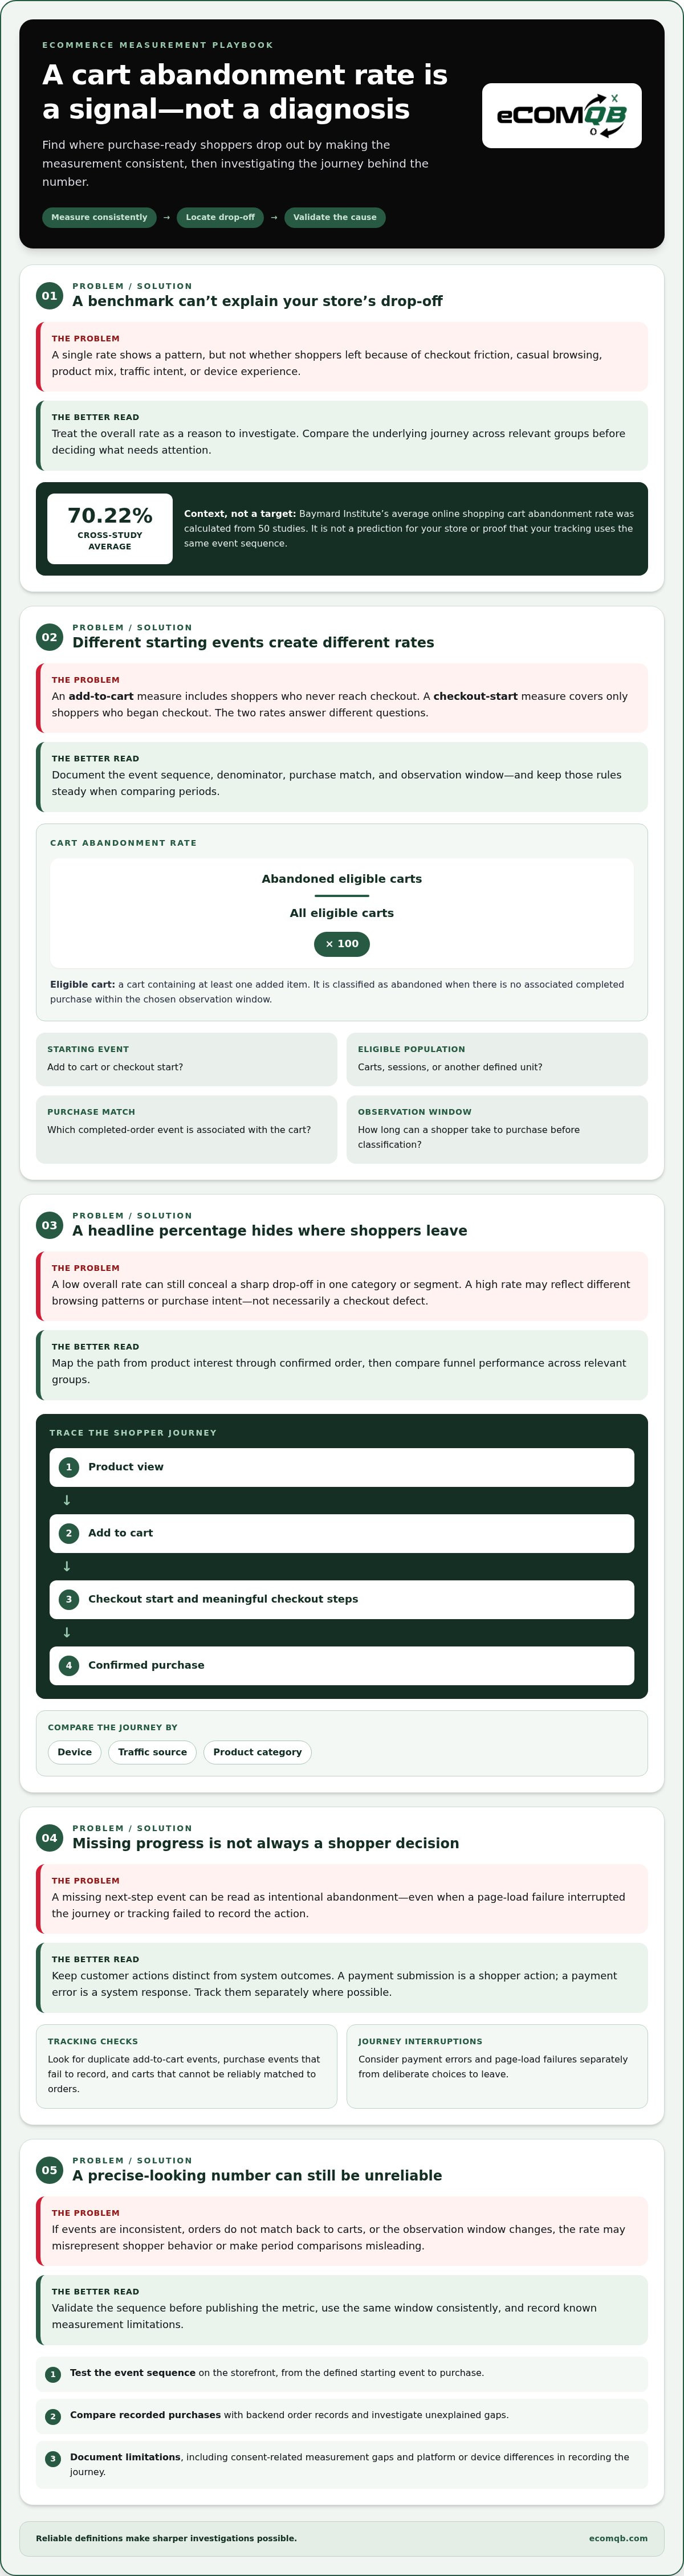
Baymard Institute’s average cart abandonment rate is 70.22%, calculated from 50 studies. But that benchmark won’t tell you why shoppers leave your store. Effective eCommerce cart abandonment analysis starts with a sharper question: where does your own checkout lose purchase-ready customers, and what evidence points to the cause?
A single abandonment percentage can flag a problem, but it can’t locate the friction. Cart events, checkout steps, and campaign reports may count different behaviors, leaving teams with conflicting signals. Launching generic recovery tactics before validating the cause can waste effort or mask the real issue.
This practical guide shows you how to establish a reliable, store-specific baseline, align the events and definitions behind it, and identify the checkout stages and customer segments with meaningful drop-off. You’ll learn how to distinguish likely purchase friction from routine browsing, prioritize fixes based on evidence, and test whether each change improves completed purchases. The goal isn’t to chase a universal benchmark or eliminate every abandoned cart. It’s to build a continuous analysis discipline that turns reliable measurement into focused, measurable growth.
Key Takeaways
- Use eCommerce cart abandonment analysis to set consistent measurement rules, so your reporting reflects the same events, denominator, and time window.
- Map the full journey from product view to purchase to reveal where shoppers drop out, not just how many leave.
- Compare funnel performance by device, traffic source, customer type, and product category to pinpoint where friction may be concentrated.
- Test suspected causes against customer feedback and behavioral signals before choosing a fix.
- Rank prevention and recovery experiments by impact, evidence, effort, and customer experience, then track whether they improve results.
What eCommerce Cart Abandonment Analysis Measures, and What It Cannot Tell You
A useful abandonment metric is more than a percentage pulled from a dashboard. It is the outcome of a defined sequence: a shopper creates a cart or starts checkout, then either completes an order or does not within the period you choose. The event that begins the sequence determines what your rate actually describes.
Cart abandonment rate is the percentage of eligible carts containing at least one added item that have no associated completed purchase within the chosen observation window. Calculate it by dividing abandoned eligible carts by all eligible carts, then multiplying by 100.
Cart abandonment rate versus checkout abandonment
If the starting event is add to cart, the metric includes shoppers who never proceed to checkout as well as those who leave during checkout. If it starts at checkout start, it measures a narrower group: shoppers who began checkout but didn’t complete an order. The two rates answer different questions, so don’t treat them as interchangeable.
Before comparing weeks or months, document the event sequence, denominator, and observation window. For example, if one report counts carts and another counts checkout starts, a change in the reported rate may reflect a changed definition, not changed customer behavior. Keep the rules steady, then assess performance.
Why a high or low rate is not a diagnosis
The headline number shows a pattern, not its cause. A high rate might coincide with more casual browsing, a shift in product mix, or a traffic source bringing shoppers with different levels of purchase intent. Device differences can also change how customers experience the same path. A low overall rate can still hide a sharp drop-off for one product category or customer segment.
Use the overall rate as a signal to investigate. Then compare the underlying journey across relevant groups. Until you know which shoppers are leaving and where, the metric can’t tell you whether the priority is product information, checkout friction, traffic quality, or another factor.
Benchmarks can provide context, but they aren’t universal targets. Baymard Institute reported an average online shopping cart abandonment rate of 70.22%, calculated from 50 studies. Its meta-analysis was last updated on September 22, 2025. That figure is a cross-study average, not a prediction for your store or proof that your tracking uses the same event sequence. Treat it as a reference point, not a pass-or-fail score.
Measurement quality matters, too. If an add-to-cart event fires twice, a purchase event fails to record, or the cart and order can’t be reliably connected, the calculated rate may misrepresent what shoppers did. Check that relevant events are recorded consistently and that your reporting rules address these practical details:
- Starting event: Does the analysis begin at add to cart or checkout start?
- Eligible population: Are you counting carts, sessions, or another clearly defined unit?
- Purchase match: What event counts as a completed order associated with that cart?
- Observation window: How long can a shopper take to purchase before the cart is classified as abandoned?
Define these inputs first. Then your eCommerce cart abandonment analysis can support consistent comparisons and sharper investigations, instead of producing a precise-looking number with an unclear meaning.
How to Build a Reliable eCommerce Cart Abandonment Measurement
Build the measurement before interpreting the result. A disciplined eCommerce cart abandonment analysis follows the same sequence every time: define the events, validate tracking, set an observation window, segment the journey, and report the rules alongside the findings. Consistent event definitions are essential for meaningful period-over-period comparisons.
Map the checkout funnel before interpreting drop-off
Start with a written map of observable events from product interest to confirmed order. Include product view, add to cart, checkout start, each meaningful checkout step, and purchase. Add relevant campaign events, such as an ad click or recovery-message click, when they help explain how shoppers entered or returned to the journey. Record the event name, what triggers it, and which shopper or cart it should represent.
Keep customer actions distinct from system outcomes. A shopper submitting payment is an action; a payment error is a system response. A page-load failure may interrupt the journey without producing the next expected event. Track these separately where possible, so missing progress isn’t automatically interpreted as a deliberate decision to leave.
Choose a measurement window and validate the data
Choose an observation window that reflects how long customers typically take to complete a purchase, then apply it consistently. A window that’s too short can classify delayed orders as abandoned; one that’s too long can blur which activity belongs together. Record the chosen rule, including how you match a completed order to the earlier cart or checkout.
Before publishing the metric, test the event sequence on the storefront and compare recorded purchases with backend order records for unexplained gaps. Document known limitations, including consent-related measurement gaps and differences in how platforms or devices record the journey. Don’t try to fill missing consent-based data by assuming every unobserved action occurred.
Use this operating sequence:
- Define the denominator. Specify whether the analysis starts with carts, checkout starts, or another tracked event, and what counts as an eligible record.
- Validate event behavior. Check that each event fires at the intended step. Look for duplicates, missing events, inconsistent identifiers, and purchases that appear in order records but not analytics.
- Set the window. Choose a consistent period for associating cart activity with a completed order, based on the store’s purchase cycle.
- Segment the funnel. Report the same defined steps by useful dimensions such as device, traffic source, customer type, or product category. Note where consent or platform differences limit comparison.
- Publish the context. Include the event definitions, window, tracking changes, campaign changes, and known data limitations beside each report.
This reporting discipline makes movement in the numbers easier to interpret. If tracking changed between periods, flag the break rather than presenting the results as a clean like-for-like comparison. If a checkout step’s recorded volume suddenly falls while backend orders remain steady, investigate instrumentation before assuming shopper behavior shifted.
When measurement is spread across analytics, storefront, and order systems, a structured revenue measurement review can help turn the event map into a dependable foundation for optimization.
How to Find the Cause: Compare Segments, Signals, and Customer Feedback
Once the funnel data is dependable, look for patterns tied to a decision you can make. Compare progression through the same steps by device, traffic source, new or returning visitor, and product category. Keep event definitions and the observation window consistent across groups; otherwise, an apparent difference may come from measurement rather than shopper behavior.
Compare segments without creating misleading conclusions
Start with a focused question, such as whether mobile shoppers are less likely than desktop shoppers to complete a particular checkout step. Check whether the pattern persists across reporting periods and whether the groups have enough complete data to support a useful comparison. Flag small or consent-limited samples as inconclusive. A segment can point to where to investigate, but it doesn’t explain why shoppers behave differently.
Resist slicing the data into every possible combination. Too many comparisons make random fluctuations look meaningful. Select segments that could change the next action, then look for repeatable patterns over time. For example, a payment-step drop-off concentrated among one device group is a stronger investigation lead if it recurs. A one-period spike may instead reflect a campaign mix shift or incomplete tracking.
Pair funnel evidence with customer feedback
Analytics shows where shoppers leave, while feedback can suggest why. Offer a concise, optional question at a relevant point in the journey, such as after checkout exit. Keep the prompt neutral and allow shoppers to skip it. Group open responses into themes such as delivery expectations, payment friction, account requirements, or uncertainty about the product. Treat responses as useful context, not a complete account of every shopper’s decision.
Compare each hypothesis with evidence on both sides:
- Unexpected delivery cost: Supporting signal: drop-off rises when delivery charges appear. Contradicting signal: the pattern also appears before delivery details are shown.
- Payment friction: Supporting signal: shoppers reach payment but don’t complete, and voluntary comments mention payment trouble. Contradicting signal: the same loss occurs earlier in the funnel.
- Account requirement: Supporting signal: abandonment clusters around an account-creation step, with comments citing sign-up. Contradicting signal: shoppers leave before that step appears.
- Product uncertainty: Supporting signal: one category has weaker progression and comments raise product questions. Contradicting signal: the same drop-off affects unrelated categories at the same checkout step.
These signals strengthen or weaken a hypothesis; they don’t prove causation on their own. A campaign may bring lower-intent visitors while a checkout issue occurs at the same time. Don’t assume one caused the other. Compare patterns across relevant segments, review customer comments, and look for evidence that could disconfirm your first explanation.
Use the combined findings to define the next test. If behavior and feedback point to the same friction, investigate a targeted change and measure its effect on the relevant funnel step. If they conflict, gather better evidence before changing the experience. Strong eCommerce cart abandonment analysis is disciplined investigation: compare, challenge, then validate.
How to Prioritize Cart Abandonment Fixes and Test Recovery Tactics
A long list of possible fixes can stall action. Rank each finding by four factors: funnel impact, evidence strength, implementation effort, and customer-experience risk. Start with issues that affect a meaningful funnel step, have multiple supporting signals, are practical to test, and carry limited risk of making the experience worse.
Separate prevention from recovery. Prevention changes the shopping or checkout experience before a customer leaves. Recovery tactics, such as email or SMS, follow an abandonment event. They solve different problems, so give each its own hypothesis and measurement plan. A recovery message shouldn’t substitute for fixing a checkout barrier identified by the evidence.
Choose the first intervention from the evidence
Target the stage where reliable data shows the clearest drop-off. If shoppers leave after delivery details appear, test clearer delivery information earlier in the journey. If a lengthy form coincides with a checkout-step decline, test reducing its complexity. Account requirements and payment experience can also be hypotheses, but act on them only when store-specific signals support the case.
Write each idea as a testable statement: “If we make delivery expectations clearer before checkout, more eligible shoppers will complete an order.” Set a primary metric, such as completed orders per eligible checkout start, and guardrails such as average order value, payment errors, or customer-support signals. Avoid defaulting to discounts when the evidence points to another barrier; incentives can add cost without addressing the cause.
Measure recovery without overstating attribution
Before launching email, SMS, onsite prompts, or retargeting, define how you’ll compare outcomes. If practical, hold out a comparable eligible group from the recovery activity. Otherwise, use a clearly documented comparison method and acknowledge its limits. An order recorded after a message click is associated with that message; timing alone doesn’t prove the message caused the purchase.
Keep the test interpretable. Change one meaningful variable at a time where practical, and document the audience, exclusions, test duration, and any overlapping campaign or site changes. Judge success by completed orders and relevant revenue measures, not opens, clicks, or message-attributed orders alone. Engagement can show that a message drew attention, but it doesn’t establish incremental sales.
Use a simple decision sequence to keep the work focused:
- Rank the finding. Record likely funnel impact, strength of evidence, effort, and experience risk.
- Choose the intervention. Address the observed barrier, or select a recovery tactic for shoppers who have already left.
- Set the test. Define the hypothesis, eligible audience, primary metric, guardrails, and comparison method before launch.
- Review the outcome. Separate observed association from demonstrated lift, then decide whether to adopt, revise, or stop the change.
This is where eCommerce cart abandonment analysis becomes an operating discipline: findings drive controlled experiments, and results shape the next priority. Plan a data-led revenue optimization conversation to turn your checkout findings into a focused test roadmap.
Make Cart Abandonment Analysis a Continuous eCommerce Growth System
A checkout finding matters most when it changes what the business does next. Treat cart analysis as a recurring operating cycle: review the journey, validate the signal, prioritize an improvement, and measure what happens after implementation. This keeps the team focused on sustained conversion and lifecycle performance, not a one-time dashboard review.
Connect abandonment findings to the wider revenue picture
A checkout change can affect more than completed orders. Consider how it relates to revenue per visitor (RPV), overall conversion performance, recommendation effectiveness, lifecycle marketing efficiency, and repeat purchases. A fix that improves checkout completion but changes order value or repeat behavior needs a wider review before you judge its value.
eComQB’s Revenue Audits assess these measures together, connecting funnel observations to the broader revenue picture. That perspective aligns with an eCommerce AI growth system built around acquisition, conversion, and retention. Cart recovery is one lever in that system, not a substitute for understanding how customers are acquired and retained.
Build an accountable cycle of review and optimization
Turn each audit into an action plan with an owner, a defined measure of success, and a follow-up review. Revenue Optimization can connect verified checkout findings with merchandising improvements, lifecycle flow optimization, and campaign performance analysis. For example, if the evidence points to uncertainty about products, review recommendation effectiveness; if customers leave during checkout, assess the relevant conversion step before changing lifecycle messaging.
AI can support this work as an operating layer on proven growth frameworks, not as a standalone source of growth. AI transformation for eCommerce brands involves implementation and operational change, followed by ongoing review. Governance matters too: monitor data quality and output accuracy, and assess automation health and recommendation accuracy. This oversight helps teams spot issues; it doesn’t promise error-free automation.
For lifecycle recovery, connect the message strategy to the validated customer journey. Agentic email marketing can be considered within that broader lifecycle approach, with performance evaluated against meaningful business outcomes rather than engagement alone.
Keep the loop moving: audit, prioritize, implement, review, and refine. Each cycle should capture what changed, what the evidence showed, and what the team will test next. That’s how eCommerce cart abandonment analysis becomes a practical growth discipline across conversion and retention.
Ready to turn your findings into a prioritized optimization plan? Book a consultation to discuss your analysis priorities with eComQB.
Turn Your Next Finding Into a Growth Move
The most valuable next step isn’t another dashboard. It’s choosing one meaningful growth priority, assigning ownership, and setting a review rhythm that keeps the work moving. As customer behavior and campaigns change, revisit your assumptions and adjust the plan based on fresh evidence. That’s how eCommerce cart abandonment analysis becomes a durable advantage, not a one-time exercise.
eComQB’s original growth program began in 2002 and spun off into eComQB in 2017 after 15 years, representing almost 25 years of experience. Its Managed AI Operations includes model performance reviews, automation health monitoring, and recommendation accuracy analysis, supporting ongoing oversight as teams put proven growth systems into practice.
Bring your highest-priority measurement question and turn it into a clear next move. Book a free consultation with eComQB to discuss where your analysis can create the greatest opportunity. Your next improvement starts with one well-chosen test.
Frequently Asked Questions
What is a good eCommerce cart abandonment rate?
There’s no single rate that’s good for every store. A useful target is a sustained improvement against your own baseline without harming order value, conversion quality, or customer experience. Compare like-for-like periods and segments, such as the same device mix or product category. If the overall rate improves while a key customer group struggles, the headline may hide a problem worth addressing.
How do you calculate the cart abandonment rate?
Divide eligible carts without a matched completed order by all eligible carts in the same measurement period, then multiply by 100. For example, if 50 of 200 eligible carts have no matched order by the end of your chosen window, the rate is 25%. State whether your denominator is carts or checkout starts, since that choice changes what the result represents.
How long should you wait before calling a cart abandoned?
Choose a window that fits your store’s buying cycle, then apply it consistently. A shopper purchasing a considered item may need more time than someone replenishing a familiar product. Review historical time-to-purchase patterns to inform the cutoff, and distinguish that reporting window from the timing of a recovery message. Revisit the rule if buying behavior changes, documenting the adjustment so trend comparisons remain clear.
Can cart abandonment analysis identify why a specific shopper left?
Usually, no. Funnel data can show the step where a shopper stopped progressing, but it can’t reliably reveal an individual’s motivation. A person may leave to compare options, get interrupted, or encounter a site issue. Use aggregated behavioral patterns and optional customer feedback to form hypotheses. Avoid treating a single session or survey response as a definitive explanation for that shopper or the wider audience.
Should you offer a discount in every abandoned-cart message?
No. A discount may recover some purchases, but it can also reduce margin or teach customers to wait for an incentive. Match the message to the suspected barrier: clarify product details or delivery expectations if those are the issue, and test an offer only when evidence supports it. Compare completed orders and revenue outcomes, not clicks alone, and consider whether non-discount messages perform effectively.
How can you analyze abandonment when customers switch devices?
Cross-device analysis depends on whether activity can be responsibly connected across sessions. Where shoppers sign in, an account-based identifier may help associate their journey, subject to your consent and data practices. Without a reliable shared identifier, treat device-level paths as separate and report that limitation. Don’t assume a mobile visit and later desktop purchase belong to the same person just because their timing appears related.
Does cart abandonment analysis require AI?
No. You can establish useful measurement with consistently defined events, accurate order data, and focused segment comparisons. AI may help teams process larger datasets, identify patterns, or support personalized recovery, but it can’t replace sound measurement or business judgment. If you add AI, monitor input data quality and output accuracy, and evaluate whether the system improves decisions or outcomes against a clear baseline.
Ready to turn your cart and checkout findings into a focused optimization plan? Book a free consultation with eComQB.