
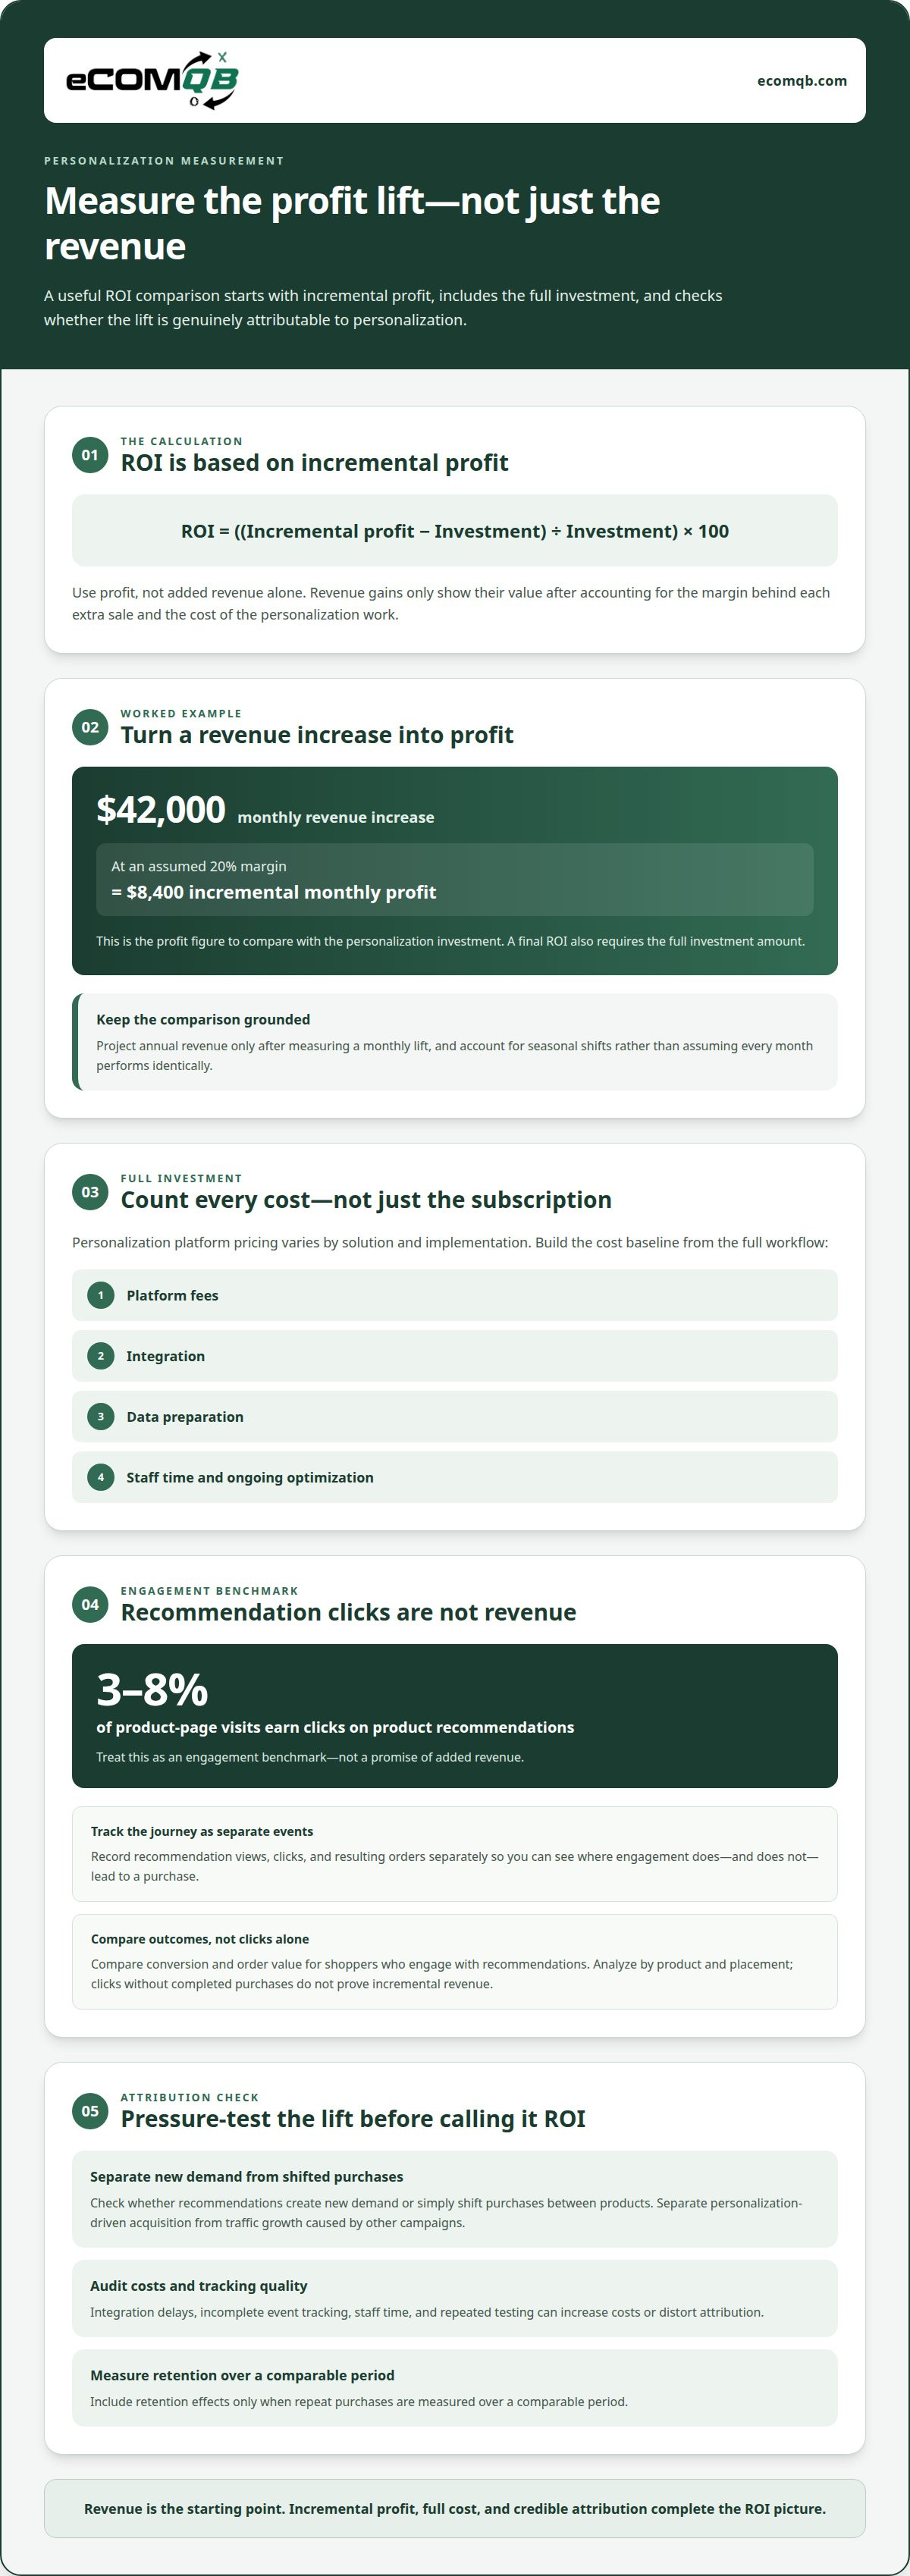
Calculating ROI of eCommerce personalization starts with comparing the incremental profit it generates against the cost of the investment. Subtract the personalization investment from the added profit, divide the result by the investment, then multiply by 100 to express ROI as a percentage. Use profit, not added revenue alone, so the calculation accounts for the margin behind each extra sale.
Revenue gains are encouraging, but they don’t tell the whole story. A change in conversion rate or average order value matters only when you can connect it to incremental profit and compare it with the cost of the experience.
This guide explains how to build that comparison, track changes in conversion and order value, and use analytics and event tracking to distinguish personalization’s impact from other changes. You’ll also learn how to test whether a lift is real with a holdout group and interpret the result before deciding what to optimize next.
Key Takeaways
- Compare personalization’s incremental profit with its full investment to calculate ROI, rather than treating added revenue as profit.
- Measure conversion-rate changes against a control group so you can distinguish personalization’s impact from other shifts in store performance.
- Track average order value alongside conversion rate to see how recommendations, cross-selling, and upselling affect revenue.
- Use analytics and event tracking to connect customer interactions with outcomes, then use those insights to guide your next optimization.
Comparing personalization costs with additional revenue
Build your comparison around incremental profit, not revenue alone. Track recommendations, acquisition, retention, and the investment required to achieve each gain.
-
Identify Personalization Platform Costs
List the platform’s full costs before estimating returns. There’s no single average cost for every eCommerce personalization platform: pricing varies by solution and implementation. Include platform fees, integration, data preparation, staff time, and ongoing optimization in your calculation. Don’t treat the subscription as the full investment. A clear cost baseline helps prevent hidden work from overstating ROI.
-
Estimate Revenue From Product Recommendations
Measure recommendation-driven purchases against a comparable baseline. Product recommendations earn clicks on 3-8% of product-page visits, a benchmark to use when assessing engagement, not a promise of added revenue. Track recommendation views, clicks, and resulting orders as separate events. Then compare conversion and order value for shoppers who engage with recommendations. Analyze behavior by product and placement; clicks without completed purchases don’t prove incremental revenue.
-
Assess Annual Revenue and Potential ROI
Project annual revenue only after establishing a measured monthly lift. Apply the monthly change across the year, accounting for seasonal shifts rather than assuming every month performs identically. For example, a $42,000 monthly revenue increase produces $8,400 incremental monthly profit at an assumed 20% margin. Calculate ROI as incremental profit minus investment, divided by investment, multiplied by 100. Compare the result with acquisition and retention gains, not gross sales alone.
-
Account for Risks and Hidden Costs
Audit the full workflow before treating projected ROI as a result. Integration delays, incomplete event tracking, staff time, and repeated testing can increase costs or distort attribution. Check whether recommendations shift purchases between products rather than create new demand. Separate personalization-driven acquisition from traffic growth caused by other campaigns. Include retention effects only when repeat purchases are measured over a comparable period.
Personalized digital experiences and conversion rates
Measure conversion changes against a clear baseline, then connect the lift to revenue. GDPR and CCPA can affect customer-data collection and use, limiting available personalization signals and attribution. Account for those constraints in your analysis.
- Set a conversion baseline. Record visitors, completed orders, and conversion rate before changing the experience. An eCommerce conversion rate of 1% to 2% is considered acceptable, but your store’s own baseline is the useful comparison. Track by device and traffic source so shifts in audience mix don’t disguise the result.
- Project the conversion impact. Calculate monthly revenue as unique visitors multiplied by conversion rate and average order value. For example, a 10% conversion-rate increase from 2% to 2.2% raises orders if traffic and order value hold steady. Treat this as a projection, then compare it with observed test results.
- Prioritize cart and mobile friction. Nearly 70% of eCommerce shopping carts are abandoned on average, so examine checkout exits and the steps before purchase. More than 60% of eCommerce traffic comes from mobile devices. Mobile optimization can increase eCommerce conversions by 15-30%; review page speed, product details, and checkout usability on smaller screens.
- Test relevant upsells. Track whether targeted offers change conversion and average order value, not just clicks. McDonald’s upsell messaging increased conversion rate by 7.64% and average order value by 12.89%. Use those as examples of distinct outcomes, not forecasts for your store. Compare each offer with a control and assess the resulting revenue.
Use those insights to prioritize the next experiment. If you want support shaping a personalization measurement plan, connect the test design to your store’s conversion goals.
Average order value increases through cross-selling and upselling
Cross-sells and upsells can increase average order value, but only measured orders show their actual impact. Follow the customer journey from offer exposure to purchase, then connect attributable revenue to return on investment.
- Choose a relevant offer. Pair a complementary product with the item already under consideration, or suggest an upgraded option. Use browsing behavior and cart contents to make the recommendation relevant to that shopper’s journey. Track which offer appeared, where it appeared, and whether the shopper purchased. An unrelated offer can distract customers without increasing order value.
- Measure attributed orders. Separate recommendation views, clicks, and completed orders in your metrics. In one benchmark, 7% of visits where shoppers clicked a recommendation drove 24% of orders. Use this as a prompt to inspect your own attributed orders, not as a forecast. Compare recommendation-engaged orders with a suitable control group to identify incremental purchases.
- Calculate the average order value increase. Divide revenue by orders for both the personalized experience and its comparison group. A worked example raises average order value from $100 to $110 and produces monthly revenue of $242,000. That example shows how a higher basket value affects revenue; your result depends on actual order counts and traffic.
- Connect the lift to return on investment. Track order value alongside average items per transaction and gross margin by product type. A larger basket may contain lower-margin products, so revenue alone can overstate the gain. Compare the incremental profit from attributed orders with the investment required to deliver the offers. Review results by offer type, product, and customer segment before scaling.
ROI measurement through analytics and event tracking
Use analytics to link personalized experiences to incremental outcomes, not just clicks. Track conversion, order value, and profit alongside engagement to see whether the customer experience delivers commercial value.
Which metrics measure the impact of eCommerce personalization? Track conversion rate, average order value, revenue per visitor, and gross margin. Event data on recommendation views, clicks, and purchases helps show how visitors move from engagement to orders.
-
Establish the Purpose of ROI Measurement
First define the decision your measurement should support, such as scaling a recommendation or revising an offer. ROI tracking helps eCommerce businesses assess performance and identify opportunities to improve or grow. Set the desired outcome, then align analytics events with it. Don’t treat engagement as the final score: a click matters commercially only when it contributes to an order or another defined result.
-
Compare Before-and-After Results
Record a baseline before launching personalization, then compare equivalent periods and visitor segments. For context, 100,000 monthly visitors, a 2% conversion rate, and a $100 average order value produce $200,000 in monthly revenue. Use the same calculation after launch, while accounting for traffic and seasonal changes. A holdout group provides a stronger comparison: a 5-10% share of visitors sees the non-personalized experience.
-
Track Metrics With Analytics and Events
Configure events for exposure, recommendation clicks, add-to-cart actions, purchases, and refunds. Connect those events to conversion rate, average order value, revenue per visitor, and gross margin. For a store with 50,000 monthly visitors, a 5-10% holdout represents 2,500-5,000 non-personalized sessions monthly. Run the holdout for at least 3 months before drawing conclusions. At that traffic level, conversion-rate tests may need roughly 2-4 weeks for statistical significance.
Turn measurement into a growth system with a data-led personalization strategy built around clear events and commercial outcomes.
EComQB: Revenue Generating AI Tools
eComQB helps eCommerce brands turn personalization insights into growth priorities with Revenue Generating AI Tools and AI transformation for eCommerce Brands. When measurement reveals an opportunity that needs coordinated execution, Agentic Media Buying and Meta Advertising Execution can support the broader growth strategy. These offerings suit brands ready to connect customer experience, acquisition, and performance measurement instead of treating personalization as a standalone tactic.
Use your ROI findings to choose the next step: refine the experience, strengthen campaign execution, or align both with measurable business goals. Contact eComQB to discuss your eCommerce growth priorities.
Make the Next Move With Confidence
A disciplined approach to calculating ROI of eCommerce personalization turns measurement into a decision-making advantage. Start with one customer journey where a better experience could support a clear business objective. Define success for that journey, assign ownership, and use the results to decide what to refine or scale.
That focus keeps experimentation strategic. Rather than adding personalization simply because the technology allows it, direct effort toward opportunities that matter to your growth plan. Strong execution connects customer relevance with commercial priorities and gives your team a repeatable way to learn and improve.
If you’re ready to put your findings into action, contact eComQB to discuss your ROI. Bring your goals and the questions your measurement has surfaced. You can turn those insights into a sharper growth plan and a more deliberate next move.
Frequently Asked Questions
How are calculations made?
Compare a personalized audience with a comparable group seeing the standard experience, then isolate the difference. For example, calculate revenue per visitor in each group and apply the gap to eligible traffic. Then account for product margin and attributable costs. Keep traffic source, device mix, and offer exposure consistent so the result reflects personalization rather than differences in the audience.
How Much Can Personalization Boost Your ROI?
Effective personalization produces 5-15% revenue lifts and 10-30% marketing ROI improvement. Treat these as benchmarks, not a forecast for an individual store. Your measured result depends on the experience, audience, product margins, and execution. Compare the lift from your test with its full investment, then use the findings to prioritize the personalization efforts that contribute most to profitable growth.
How is the average improvement for each metric determined?
Calculate each metric separately, using the same audience definition and comparison period. For example, compare conversion rates across all eligible sessions, but calculate average order value from completed orders. Segment results by device, traffic source, and product category to see where changes occur. Combining different audiences or denominators can make an apparent average lift misleading.
How is ROI for eCommerce personalization calculated?
Divide incremental net profit by the personalization investment, then multiply by 100 to express the result as a percentage. Use incremental profit attributable to the experience, not total store profit or gross sales. For a reliable decision, define attribution before launch and avoid crediting personalization for purchases that would likely have happened without it.
What costs should be included in eCommerce personalization ROI?
Include expenses directly tied to creating and evaluating the experience, such as test-specific creative, event instrumentation, quality assurance, and incremental discounts. Count internal operating time when teams maintain or review the experience. Keep unrelated store overhead separate unless the initiative changes it. This approach reveals the true cost of each test without assigning it business-as-usual expenses.
How do personalized product recommendations affect conversion rates and average order value?
Recommendations can influence whether a shopper buys and what they add to an order, so assess conversion rate and average order value separately. Compare all eligible sessions to measure conversion, then examine completed orders for basket changes. Break results down by recommendation placement and product category. This helps distinguish an overall purchase lift from a shift in the items customers choose.