ECommerce performance benchmarks for key rates and revenue tiers

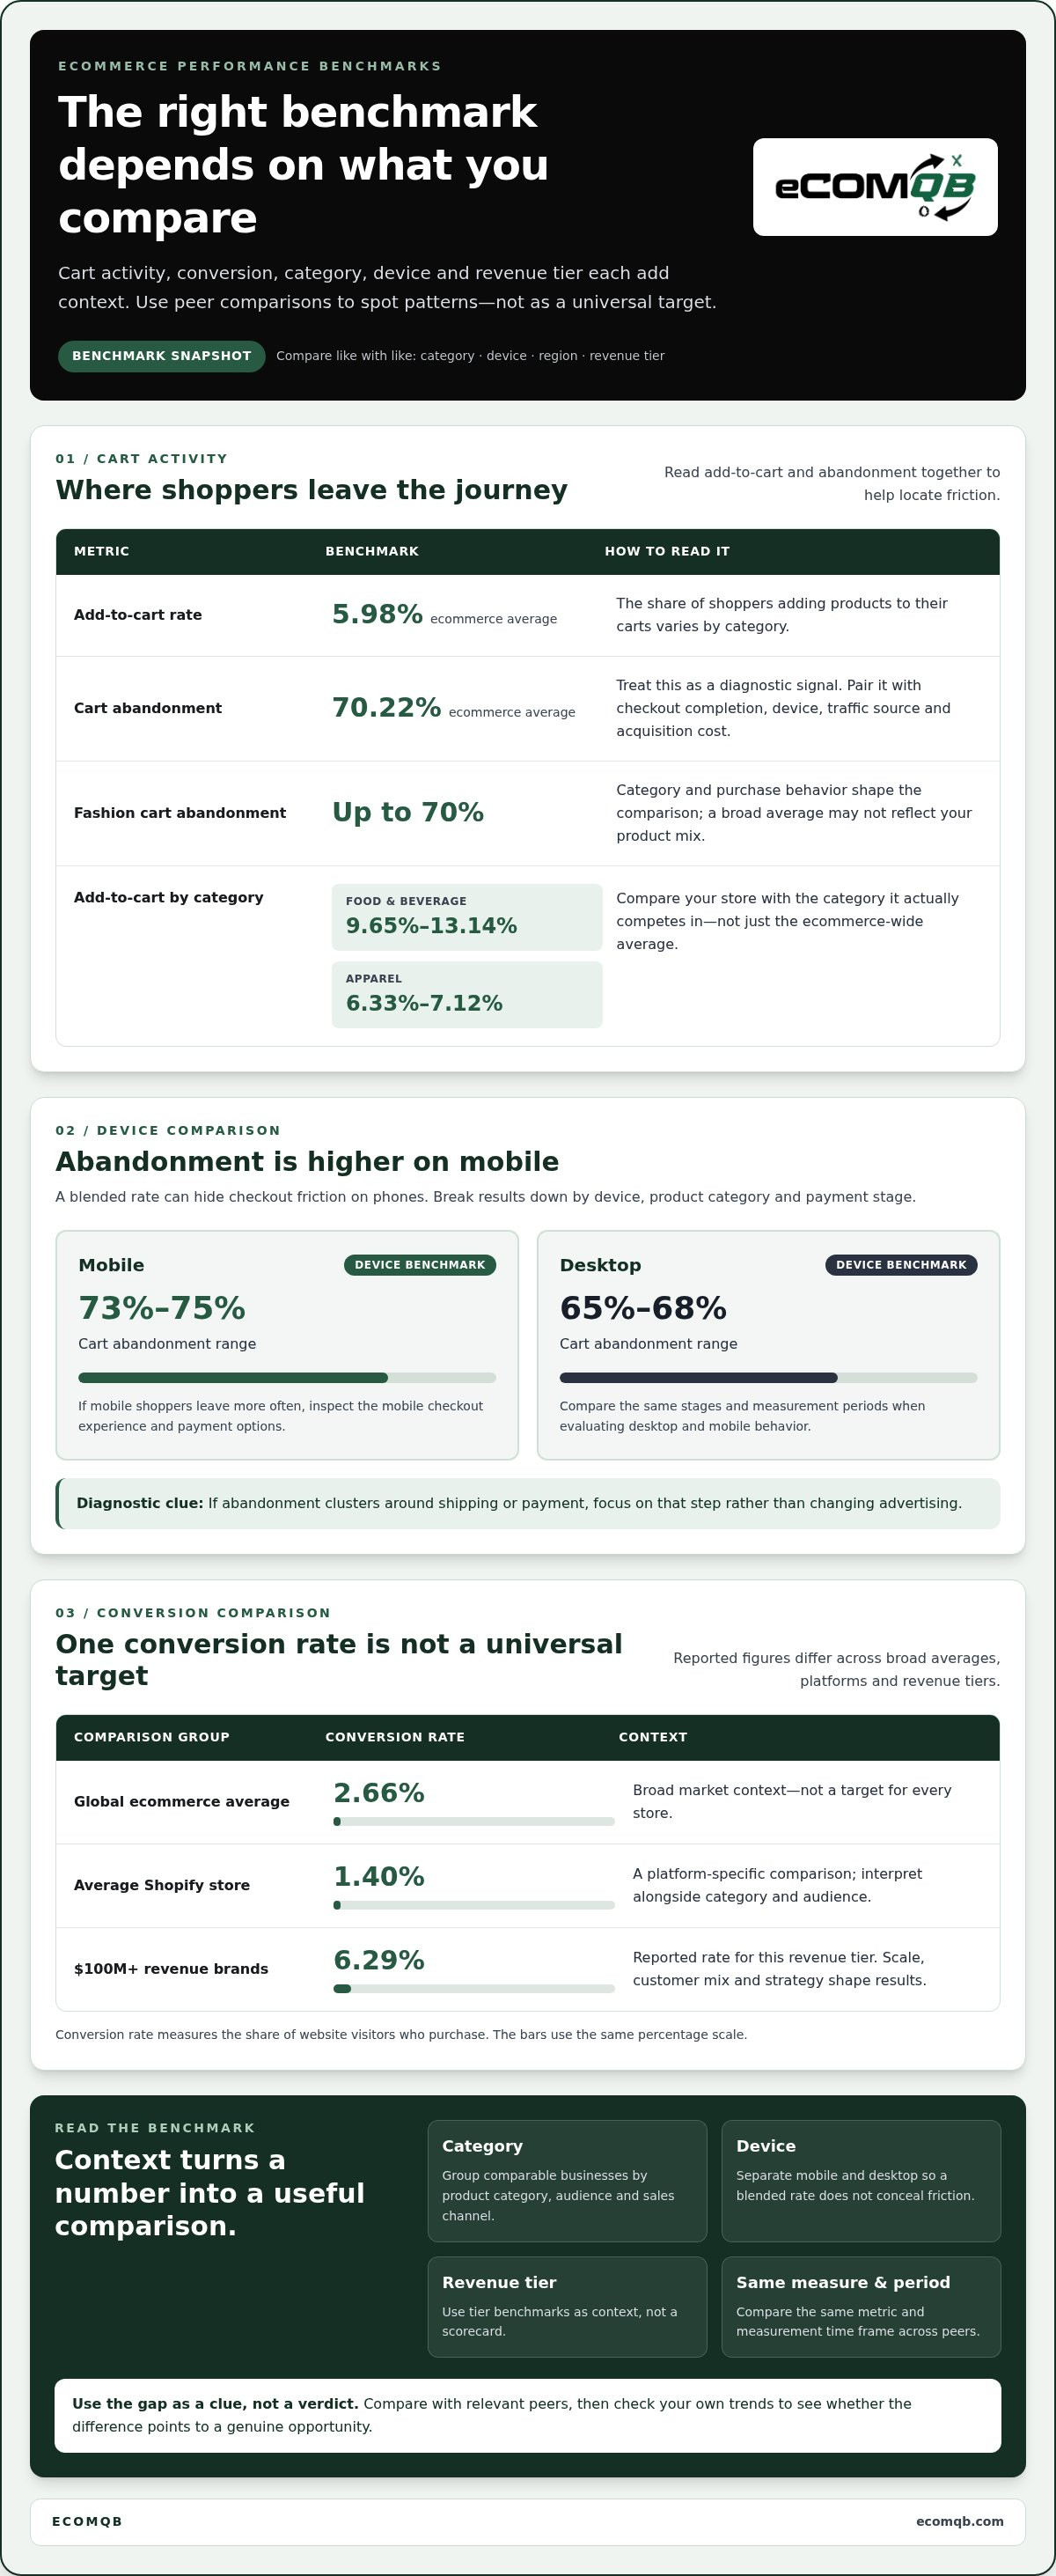
Revenue tier can shift the benchmark: brands with $100M+ in revenue are reported to have a 6.29% conversion rate, compared with the global ecommerce average of 2.66%. Benchmarking eCommerce performance means comparing rates and revenue indicators with relevant industry and brand peers, not treating one average as a universal target. The average ecommerce add-to-cart rate is 5.98%, while the average cart abandonment rate is 70.22%.
Those figures offer a starting point, but the right comparison depends on what you sell, how shoppers buy, and the revenue tier your brand is targeting. A broad average can flag a gap; comparing with closer peers helps reveal whether it reflects a category-wide pattern or a specific growth opportunity.
This guide covers ecommerce benchmarks for cart activity, conversion, industry performance, and revenue tiers. Learn how to interpret the rates, avoid misleading comparisons, and turn the findings into focused growth priorities.
Key Takeaways
- Compare your results with relevant industry and revenue peers, then use the gaps to prioritize the metrics that matter most.
- Separate ad clicks, site conversion, and acquisition cost to pinpoint where paid traffic is losing efficiency.
- Read add-to-cart and cart-to-purchase rates together to see whether friction starts on product pages or later in checkout.
- Adjust conversion comparisons for industry, device, and region so broad averages don’t distort your performance targets.
- Use revenue-tier benchmarks as context, not a scorecard: scale, customer mix, and strategy shape the rates behind the numbers.
What are ecommerce benchmarks?
Ecommerce benchmarks compare a store’s metrics with industry averages and peer results. They help identify performance gaps, set relevant targets, and focus effort on the indicators that influence growth.
For useful benchmarking eCommerce performance, compare like with like: category, device, region, and revenue tier all shape the results. No single average tells the whole story.
Competitor and Industry Comparisons
Competitive benchmarking measures your commerce results against peer businesses and broader industry averages. It helps show whether a performance gap is specific to your operation or reflects a wider market pattern.
Start by grouping comparable businesses by product category, audience, and sales channel. Then compare the same metric and time frame. For example, the global average ecommerce conversion rate is 2.66%, while the average Shopify store conversion rate is 1.40%. These figures provide context, not a universal target. Industry benchmarking can also examine operations, marketing, sales, finances, and future trends.
Core Commerce Metrics
Core commerce metrics track the shopper journey from product interest to completed order. Together, they show where the buying process gains or loses momentum.
The average ecommerce add-to-cart rate is 5.98%, but category rates vary: Food & Beverage ranges from 9.65% to 13.14%, while Apparel ranges from 6.33% to 7.12%. Conversion rate measures the share of website visitors who purchase. Average order value (AOV) measures the average amount spent in one transaction. Read AOV alongside order volume and revenue: more orders can lift revenue, while a higher AOV can increase revenue per order. There is no single AOV target that fits every category or business model.
Website Speed Benchmarks
Website speed benchmarking compares how quickly pages load and how smoothly shoppers can use them. Slow page loads can undermine user experience and conversions.
Core Web Vitals assess loading performance, interactivity, and visual stability. Review these signals across key storefront pages and devices, then compare results over time. Use benchmarks to locate friction, not as a standalone score. Product-page complexity, page elements, and device conditions can all affect the experience. Pair speed data with conversion metrics to see whether technical issues coincide with weaker shopping outcomes.
Benchmarking Tools and Data Sources
Useful benchmarking combines store analytics with external market data. Google Trends, IMRG, Euromonitor, and government trade reports can help put category and market changes in context.
Build a consistent process: select comparable peers, define each metric, and use matching measurement periods. Track conversion, add-to-cart activity, average order value (AOV), and revenue together, since each reveals a different aspect of performance. Revisit comparisons as market conditions shift, then prioritize gaps with the clearest business impact. Treat benchmarks as decision support, not the sole basis for strategy. Use your own trends to test whether an industry comparison points to a genuine opportunity.
What is a normal cart abandonment rate?
The average ecommerce cart abandonment rate is 70.22%. That means many shoppers add products but leave before completing payment. Treat the rate as a diagnostic signal, not a verdict on the whole store. Pair it with checkout completion, device, traffic source, and customer acquisition cost to identify where revenue slips.
Read abandonment by device and category
Mobile abandonment ranges from 73% to 75%, compared with 65% to 68% on desktop. That gap makes device-level analytics essential: a blended number can hide checkout friction on phones. Fashion ecommerce typically has cart abandonment rates as high as 70%, illustrating how category and purchase behavior shape the comparison.
Break results down by device, product category, and payment stage. If mobile shoppers leave more often, inspect the mobile checkout experience and payment options. If abandonment clusters around shipping or payment, focus on that step rather than changing advertising. The pattern can guide your next test.
Connect paid media to customer value
Paid advertising CTR measures how often an ad earns a click; conversion rate tracks how often visitors buy. Customer acquisition cost (CAC) is the average cost of acquiring a new customer, including marketing and sales expenses. Customer lifetime value (CLV) estimates projected revenue over a customer’s relationship with the business.
No single channel CAC comparison fits every store. Costs vary with audience, competition, buying intent, and the share of visitors who purchase. Compare channels using the same new-customer definition and measurement period, then consider CAC alongside CLV. A lower click cost alone doesn’t prove more efficient acquisition.
CTR, conversion, and abandonment form a useful sequence. A weak CTR can point to an ad-audience mismatch; strong click activity with weak sales can signal landing-page or checkout friction. Analytics connect these stages, helping marketing teams distinguish traffic quality from barriers to purchase.
Track acquisition and retention by region
Regional benchmarks show why one global target can mislead. Global ecommerce acquisition volume grew 2% year over year, while acquisition in LATAM grew 117% year over year. New user acquisition in North America fell 58% year over year.
These numbers describe different market conditions, not guaranteed outcomes for an individual store. Compare acquisition trends within each region, then assess retention alongside new-customer volume. Retention measures the share of customers who keep buying after their first purchase during a given time frame. This helps show whether marketing supports lasting customer value or mainly drives first orders.
Use the findings to target the largest leak: ad relevance, landing-page conversion, checkout payment, or repeat purchase. For a focused review of paid acquisition and conversion priorities, discuss your growth benchmarks.
Add-to-cart and cart-to-purchase rates
Add-to-cart rate shows how often shoppers signal interest by placing a product in their cart. Cart-to-purchase rate tracks how many of those shoppers complete checkout. Read the rates together: the first measures product appeal, while the second shows how well the buying journey turns intent into orders.
Calculate each rate using a consistent denominator. Divide shoppers who add an item by the relevant site visitors to measure add-to-cart activity. Divide completed purchases by cart creators to measure cart-to-purchase performance. Apply the same visitor, session, and order definitions each time. Otherwise, benchmarks may compare different behaviors and produce a misleading signal.
Cart-to-purchase benchmarks can vary across industries, so compare your store with relevant peers. The Pets industry snapshot reports 44.14%. That gap shows why category context matters: a store should compare with relevant peers, not treat one market-wide figure as its target. Product consideration, buying urgency, and the checkout journey all shape whether a shopper completes an order.
Use the two rates to locate friction. Strong product-page interest with weaker cart completion points to possible issues after the add-to-cart action. Review checkout steps, delivery details, payment choices, and whether the cart matches the offer shown earlier. Low add-to-cart activity directs attention upstream, including product presentation, audience fit, and offer clarity. Change one major factor at a time so the result is interpretable.
Purchase intent can also help evaluate a campaign or experience before judging its sales impact. In an illustrative example, an initiative achieves 4% purchase intent against a brand’s historical performance of 2%. Compare the same audience and measurement method, then assess completed purchases separately. Intent signals interest; it does not replace conversion or prove that an initiative improves margin.
Retention adds another layer. It measures the percentage of customers who continue buying after their first purchase during a given time frame. Compare repeat purchasing across cohorts, acquisition sources, and product groups. A first order shows immediate conversion; repeat orders indicate whether the experience supports an ongoing customer relationship.
Keep order dynamics in view. A higher cart-to-purchase rate may reflect a smoother checkout, but order value, product mix, and repeat behavior also affect commercial results. Compare rates across consistent periods and segments, then use the pattern to choose your next test. That makes measurement a decision tool, not just a scorecard.
What is a good ecommerce conversion rate for my industry?
A good conversion rate depends on category, device, and region. Compare against relevant peers, then use your own funnel data to set a practical target. The Americas average 3.14%, while desktop ecommerce conversion rates are 1.9%, compared with 1.2% on mobile. Those differences show why traffic mix matters before judging whether your platform performs well.
Industry figures offer more context. The Food & Beverage snapshot reports a 3% conversion rate; Apparel & Accessories reports 2.02%. Beauty & Personal Care stands at 2.98%, Electronics at 2.71%, and Automotive at 1.12%. A store selling electronics shouldn’t measure itself against a food retailer without accounting for different products, buying cycles, and customer intent. Compare within the closest category first.
Rankings add another perspective. The top 20% of ecommerce stores have conversion rates of 3.2% or higher, while the top 10% reach 4.7% or higher. These figures describe high-performing groups, not automatic targets for every business. Use them to identify possible headroom, then examine product mix, device traffic, and checkout performance to understand what’s driving the gap.
Funnel analysis turns a benchmark into a strategy. Track the path from landing page to product view, cart, checkout, and completed order. If product views are strong but carts lag, review product-page clarity and offer relevance. If shoppers begin checkout but leave, inspect the steps and payment experience. In the cited Baymard Institute finding, 40% of shoppers abandon carts because of unexpected checkout costs. Clear cost information can address that specific friction point.
Cart recovery can reconnect with shoppers who leave before purchasing. Send a timely reminder that reflects the items they considered, and make the path back to checkout simple. Measure recovered purchases alongside overall conversion so recovery activity doesn’t obscure where the original funnel loses shoppers. Test message relevance and destination, then compare results by device and traffic source.
Order value matters alongside conversion. A strategy that increases completed purchases but shifts customers toward lower-value orders may affect revenue differently from one that grows basket size. Examine product combinations, complementary recommendations, and the order mix. Tie changes to the customer journey, and compare revenue and conversion rather than optimizing one metric in isolation.
Mobile deserves particular focus because mobile sessions account for 73% of ecommerce traffic. Review the mobile platform experience separately, including page load, product information, cart controls, and checkout usability. Then compare results by region and industry. Revisit benchmarks as traffic sources and customer behavior shift; the strongest target is one grounded in comparable data and your store’s own conversion funnel.
Performance differences by brand revenue tier
Revenue tier changes the context for ecommerce benchmarks. Brands doing $100M+ in revenue are reported to have a 6.29% conversion rate, an 18.9% add-to-cart rate, and a 31.9% cart-to-purchase rate. These figures describe a higher-revenue cohort. They don’t prove that revenue alone causes stronger rates, but they show why comparing brands at different scales can produce misleading conclusions.
Use revenue tier to refine your peer group, then segment performance by category, device, and customer type. A large brand may have wider brand recognition, more returning customers, or a different product mix than a smaller store. These conditions can influence conversion and abandonment. A useful comparison asks not only whether a rate differs, but which audience and buying conditions explain the difference.
The three high-revenue figures also map the buying journey. An 18.9% add-to-cart rate reflects strong product interest within that reported tier. A 31.9% cart-to-purchase rate describes how often cart activity becomes an order. A 6.29% conversion rate captures completed purchases relative to visitors. Read them together to distinguish traffic quality, product-page performance, and checkout efficiency.
For your own benchmark, compare like-for-like periods using consistent metric definitions. Segment by revenue tier first, then review category, acquisition source, device, and new versus returning customers. If cart activity is healthy but checkout completion lags, investigate payment and checkout friction. If fewer shoppers add products, review product relevance, presentation, and the fit between the campaign promise and landing page.
Revenue growth can also change the mix of shoppers and orders. More traffic doesn’t automatically mean greater efficiency, and a higher conversion rate doesn’t automatically mean stronger order economics. Track revenue alongside conversion, cart activity, and abandonment. Review repeat customers separately from first-time buyers, because retention can shape the overall picture without showing how effectively new visitors convert.
Use the tier benchmark as a reference point, not a finish line. Identify the largest gap in your funnel, choose a focused improvement, and monitor the same metric after the change. Then check whether movement holds across devices and customer segments. This turns comparison into a practical growth plan instead of a scoreboard. To translate revenue-tier gaps into a focused growth strategy, book a benchmarking strategy call.
EComQB: Revenue Generating AI Tools
eComQB helps eCommerce brands turn performance benchmarks into focused growth priorities with Revenue Generating AI Tools and AI transformation. When the data points to inefficient paid acquisition, Agentic Media Buying and Meta Advertising Execution can support a more structured approach to campaign performance.
Use benchmarking to pinpoint the gap first: traffic quality, conversion, or repeat purchase. Then match the next step to the constraint. A brand aiming to improve paid media efficiency may focus on advertising execution; a business pursuing broader operational change may consider AI transformation for eCommerce Brands. The goal is to connect each metric to an action, not to adopt technology for its own sake.
Contact eComQB to discuss how these capabilities can support your eCommerce growth priorities.
Turn the next benchmark into a growth move
Benchmarks matter most when they shape what you do next. Make each comparison a decision point: identify the gap, choose a lever, and define what progress should look like in your analytics. That turns benchmarking eCommerce performance into an operating discipline, rather than a report that sits on a dashboard.
When the challenge spans strategy and execution, eComQB offers Revenue Generating AI Tools, AI transformation for eCommerce Brands, and Agentic Media Buying. These capabilities connect performance insights with the work of improving growth systems and paid media. Start with a focused conversation about the benchmarks your business is prioritizing and the barriers between current results and your goals.
Contact eComQB to discuss your benchmarks and map a clear next move. Use the data to set direction, act with intent, and keep building momentum.
Frequently Asked Questions
How does brand size affect ecommerce performance?
Brand size changes the conditions behind performance, including audience reach, customer mix, and product range. For example, brands doing $100M+ in revenue are reported to have a 6.29% conversion rate. Use revenue tier to select more relevant peers, then compare similar categories and customer segments. A smaller brand can use that comparison to identify gaps without treating a large-brand result as an automatic target.
How often is this benchmark data updated?
There’s no single update schedule for ecommerce benchmarks. The benchmark data described here has been tracked since December 2022, but market conditions and data providers’ reporting cycles vary. For practical decisions, refresh your own comparisons regularly and whenever a major change affects traffic, products, or customer behavior. Keep each comparison period consistent, so a seasonal shift isn’t mistaken for a lasting performance change.
How should I prioritize improvements if I am below benchmarks?
Start with the metric closest to the business outcome you need, then trace the customer journey to its likely cause. For example, if advertising brings relevant visitors but few orders follow, inspect product information and checkout before increasing traffic. Choose one change, set a clear measurement period, and compare the same audience before and after. This makes it easier to see whether the change addressed the actual bottleneck.
What are current eCommerce conversion rate benchmarks by industry?
Reported industry conversion rates include 3% for Food & Beverage, 2.02% for Apparel & Accessories, 2.98% for Beauty & Personal Care, 2.71% for Electronics, and 1.12% for Automotive. Use the closest category match when setting a reference point. Then account for your product mix and traffic sources, because two stores within one industry can attract shoppers with different purchase intent.
What is a good eCommerce average order value benchmark?
Average order value (AOV) is the average amount customers spend per transaction. A useful benchmark depends on category, product mix, and purchasing patterns. Compare AOV across similar product groups and customer segments instead of blending the whole catalog. For example, separate first orders from repeat orders to see whether a change in basket composition is driving the overall figure.
What are typical eCommerce cart abandonment rates and benchmarks?
The reported average ecommerce cart abandonment rate is 70.22%. Treat it as a comparison point, then examine where shoppers leave and whether the pattern differs by device or checkout step. A store with a higher rate should investigate its own journey, such as unclear delivery details or payment friction, before deciding what to change. The overall benchmark alone can’t identify the cause.
What are common eCommerce revenue growth and retention benchmarks?
Growth and retention depend on the market and the metric being tracked. Global ecommerce acquisition volume grew 2% year over year, while LATAM acquisition grew 117% year over year. For retention, compare customer cohorts over the same time frame and distinguish first-time buyers from repeat purchasers. That reveals whether revenue momentum comes from new customer acquisition, continued purchasing, or both.
How should businesses compare eCommerce performance with competitors?
Choose peer businesses with a similar category, customer base, and sales model, then compare matching metrics across comparable periods. Keep definitions consistent: visitor-based conversion and session-based conversion can produce different readings. Use competitor and industry comparisons to raise questions, then check your own analytics for causes. For example, a category-wide change may call for a different response than a gap isolated to one traffic source.